Color diagnosis is a method for disease diagnosis based on the surface characteristics of the body and the color characteristics of its excretions and secretions. The information collected by the color clinic is irradiated on the surface of the body by natural visible light of 380-780 nm. Due to the absorption of the skin and deep tissues on the surface of the body, some of the light intensity and some spectral components are absorbed, while the rest of the light intensity and spectral components are A certain brightness and a certain color characteristic HJ reflected out. According to the characteristics of the difference of optical power distribution between 380-780 nm in different international standards, the influence of different standard illuminant conditions on the parameters of normal tongue color is studied.
1 Research objects and methods
1.1 Research object
Screening of visible reflectance spectra of normal tongue tip tongues in 35 normal undergraduate students. The subjects selected for the study required no past medical history, and the body had no abnormal performance when the data was collected, and the tongue color was pale red.
1.2 visible light reflectance spectroscopy system
The US Ocean Optics USB4000 VIS/NIR visible near-infrared spectrometer has a detection wavelength range of 360-1 000 nm, an optical resolution of 0-1.5 nm (spectral half-width), and an integration time of 3.8 ms to 10 S. The light source is LS-1 tungsten halogen lamp, WS.1 standard reflector. The components of the platform are connected by Y-shaped R400-7-VIS/NIR single-core fiber, and 6 channels around the probe component are used for light source output. Channels for the detected light input.
1.3 Spectral detection of tongue tongue color
The subjects were subjected to data acquisition after resting for 10 min at room temperature of 23-25 ​​°C. The subject took the sitting position, and the detection site was the middle of the upper surface of the tip of the tongue, and the diameter of the detection spot was 5 mm. Using LS-1 tungsten halogen lamp as the light source, adding BG-34 filter for color correction to increase the occupancy of violet light, and standardizing with WS.1 standard reflective whiteboard, the spectrum is corrected to equal energy white light (standard lighting) The relative radiation spectrum of the body E). The R400-7-VIS/NIR reflective probe is less than 10. The surface of the detection point is scanned in the vertical direction. The scanning wavelength range is 380-780 nm, the integration time is 10 ms, and the average number of times is 20 times. The visible reflection spectrum data is collected. The dark-proof Ep tube is connected to the fiber optic probe to shield the interference between the strong natural light and the illumination source, and the distance between the fixed probe and the test sample is 15 mm, and the reflectance is adjusted to 100% using the WS-1 standard reflective whiteboard. Note that the tip of the tongue should not have the coverage of the tongue coating and the presence of ecchymoses to ensure that the tongue at the test point is completely exposed.
1.4 Visible reflection spectrum and chromaticity parameter calculation
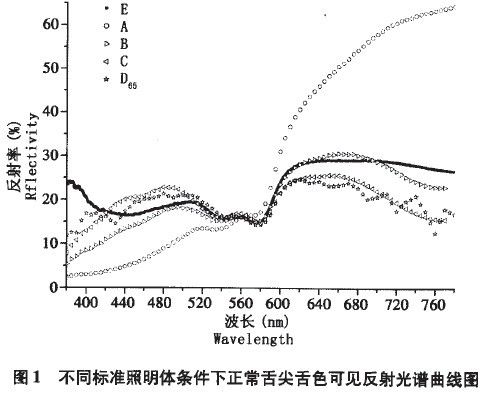
1.4.1 Visible reflection spectrum of normal tongue tongue color: The reflection spectrum data of 35 normal tongue tongue color is calculated by the mean value of wavelength-relative power, and the result of tongue color visible reflection spectrum curve of standard illumination body E is obtained. According to the curve and the relative spectral distribution characteristics of different illuminants, the visible reflection spectrum simulation calculations under the conditions of standard illuminants A, B, C and D65 were carried out to obtain the visible reflection spectrum of the tongue tongue under different illumination conditions.
1.4.2 Calculation of Chroma Parameters: Application CIE (International Commission on Illumination)
The 1964 complementary chromaticity system was used for colorimetric calculations. In the CIE 1964 standard chromaticity system, the standard chromaticity observer spectral tristimulus values ​​are represented by x, y, and z. The 10° field of view X10 Y10 Z10 chromaticity system was selected according to the characteristics of large angle of view data observation in clinical tongue or color diagnosis. The visible reflection spectrum data is calculated by the equal-wavelength interval weighting method Yang 1 according to formula (1).

Where X10, Y10, Z10 are spectral tristimulus values; 
 It is CIE 1964 supplementary standard chroma observer color matching function; R (A) is the spectral reflection factor of the reflected object color, that is, the spectral reflectance P(A); s(A) is the relative spectral power distribution of the D65 standard illuminant; K10 is the normalization coefficient; AA is the wavelength interval, and the ΔA of the visible reflection spectroscopy system is 0.20 am.
The chromaticity coordinates are expressed by X10 and Y10 and are calculated according to formula (2). The mushroom X10 and Y10 values ​​were imported into the CIE 1964 chromaticity diagram coordinates to obtain the CIE 1964 chromaticity coordinate map of the tongue color of the test subject.

Calculate the slope of the line connecting the standard white point (Xo, Yo) and the sample point (Xs, Ys) according to formula (3). The standard white point coordinates of the standard illuminants A, B, C, E, and D65 refer to the CIE standard HJ, and the constant dominant wavelength linear slope table is found to obtain the dominant wavelength.

1.4.3 RGB color space corresponding parameters: CIE based on a large number of experimental materials, selected RGB (red, green, blue) three-color system representation. The RGB color mode is the color system used by digital cameras, scanners, and displays. It is a device-dependent color space that produces colors that are specific to the device being used. In order to clarify the influence of different standard illuminant conditions on the digital imaging data of tongue color, according to the visible spectrum of the tongue tongue color under different illuminating conditions, R (700 am), G (546.1 all3.), B (435.8 nm) were obtained. ) The scores are compared and compared.
1.5 statistical methods
The program was written and calculated using Matlab 7.0 (MathWorks, USA), and the application was made using Origin 8.0 (original company, USA). The measurement data are expressed as mean ± standard deviation. The main wavelength value is compared with the RGB score result by one-way analysis of variance. The comparison of chromaticity coordinate data is performed by multivariate variable linear model analysis of variance, and SPSS software is used for numerical statistics.
2 results
2.1 Reflected spectroscopy results of normal tongue tip tongue color under different standard illuminant conditions
Under the conditions of standard illuminants A, B, C, E and D65, the visible reflection spectrum of normal tongue tip color has a large difference in optical power distribution at different wavelengths, that is, there is a significant difference in the contour of each spectral curve. Especially, the reflectance difference between the red light band of 600-780 nm and the purple light blue band of 380-500 nm is large. The results are shown in Figure 1.

2.2 chromaticity coordinate results of normal tongue tip tongue color under different standard illuminant conditions
2A is CIE 1964 chromaticity coordinates, the hollow mark in the figure is the color coordinate of different standard illuminators, the corresponding solid mark is the corresponding chromatic coordinate result of the normal tongue tip color; FIG. 2B is a partial enlargement of FIG. 2A, and is marked The standard deviation of the X10 and Y10 values ​​shows that there is a significant difference in the distribution of tongue tongue color in the CIE1964 chromaticity coordinates of the normal population under different illuminant conditions.